EUR/USD clinches highs near 1.0670 ahead of ECB
Fresh bids emerged for EUR/USD near 1.0630 region, providing extra legs to the ongoing recovery from 10-DMA located at 1.0621.Currently, the spot now gains +0.32% to trade at 1.0663, making headways towards 1.07 handle. The EUR/USD pair extends its advance, as the greenback extends its broad based retreat from Fed Yellen?s hawkish remarks induced rally witnessed in early Asia.More so, a short-covering rally in EUR/USD cannot be ruled after yesterday?s slump, as investors gear up for the ECB monetary policy decision due later in mid-Europe. The central bank is expected to make no changes to its key monetary policy tools today, while more dovish tilt could be anticipated from Draghi?s speech, as he seeks to explain markets that reduction in asset purchases does not constitute tapering. Focus also remains on the US dataflow, including building permits, jobless claims and Philly Fed manufacturing index lined up release later in the NA session.In terms of technicals, the pair finds the immediate resistance 1.0719 (multi-week high). A break beyond the last, doors will open for a test of 1.0746 (Nov 17 high) and from there to 1.0770 (100-DMA). On the flip side, the immediate support is placed at 1.0621 (20-DMA) below which 1.0600 (zero figure) and 1.0555 (50-DMA) could be tested
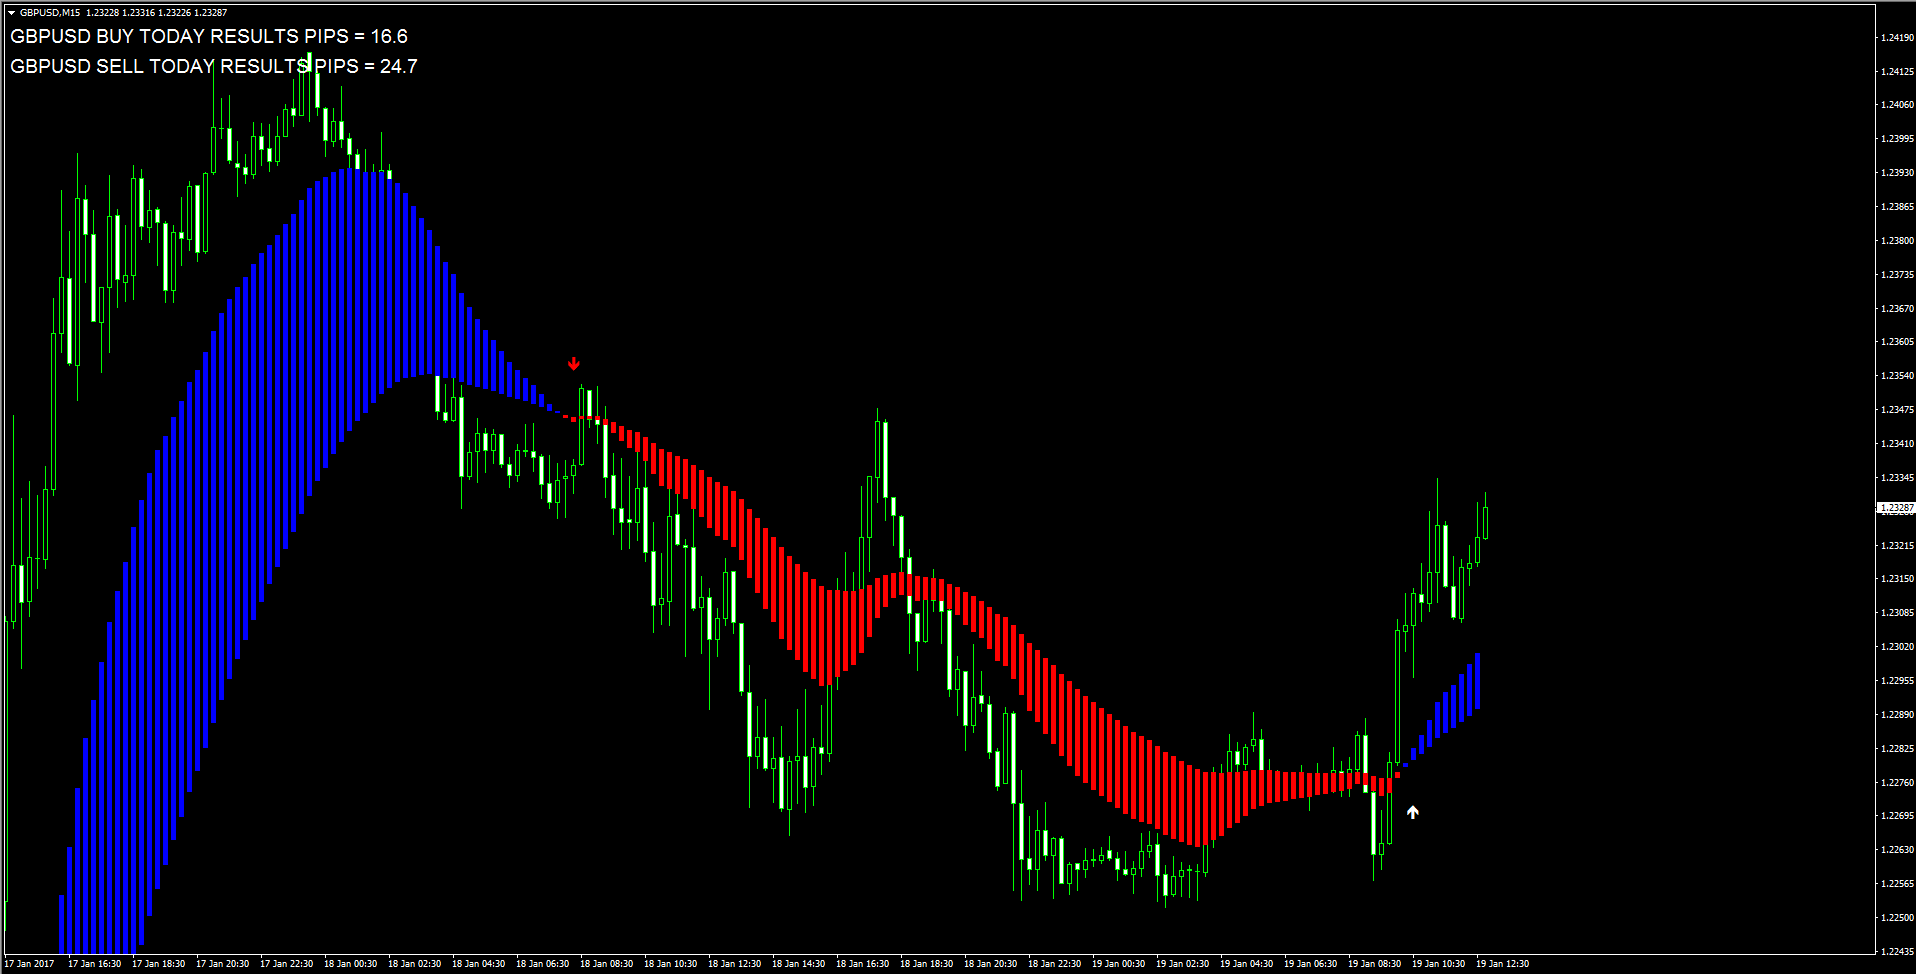
GBP/USD strong resistance lies at 1.2409/43 Commerzbank
According to Karen Jones, Head of FICC Technical Analysis at Commerzbank, Cable?s upside should find strong hurdle in the 1.2409/43 band.?GBP/USD the rebound off to the 61.8% Fibo at 1.1982 has so far been capped by the 55 day ma at 1.2409. This together with the 1.2443 resistance line should halt the rally. While capped here, a negative bias will remain entrenched, this resistance is reinforced by the 100 day ma at 1.2545. We suspect that prices will need to go sub 1.2200/1.2165 however to alleviate immediate upside pressure. We note that the intraday Elliott count is positive and for caution have partially covered shorts?.?Support at 1.1980 guards 1.1775 and then 1.1481 the recent spike low?.
AUD/JPY clocks fresh 5-week highs amid risk-on
AUD/JPY extends the rebound for the second straight session this Thursday, and remains on track to book fourth straight weekly gain.The AUD/JPY pair jumps +0.50% to fresh five-week highs of 86.53, after having a staged a solid recovery from just under 85 handle. AUD/JPY, risk barometer, rallies hard amid persistent risk-on trades, with renewed optimism sparked by Fed Chair Yellen?s comments, supporting further rate increases.Additionally, rallying oil prices lift the sentiment around the resource-linked AUD, which in-turn drives AUD/JPY higher. Strong gains seen in the cross can be largely attributed to a solid rebound staged by the AUD/USD pair. While the yen trades muted versus the greenback, providing little impetus to the prices.Markets appear to have ignored softer Aus jobs report, as they gear up for fresh cues on the sentiment from the upcoming ECB decision.
Gold under pressure for second straight session, slips below $1200 mark
Gold remained under some selling pressure for the second straight session on Thursday and is currently flirting with $1200 psychological mark.On Wednesday, the Fed Chair Janet Yellen said that the central bank would gradually raise interest rates. This coupled with upbeat US CPI print reinforced expectations of steeper Fed rate-tightening cycle, driving the US treasury bond yields higher across the board and eventually denting demand for the non-yielding yellow metal. Reviving hopes of additional Fed rate-hike actions in 2017 also extended support to the US Dollar's recovery trend and also drove flows away from dollar-denominated commodities - like gold. Investors now look forward to Trump's inauguration on Friday, which would be looked upon for more clarity on his fiscal policies and would enable investors to determine a pronounced medium-term direction for the commodity.A follow through retracement below $1195 immediate support is likely to accelerate the slide towards 50-day SMA important support near $1180 region, with some intermediate support near $1191-90 area.On the upside, $1203-05 region now becomes immediate resistance above which the commodity is likely to aim back towards nearly two-month high resistance near $1217-18 region. A convincing move above multi-month high would pave way for continuation of the metal's near-term recovery trend further towards its next resistance near $1230 level.
WTI recovery gains capped ahead of US inventory data
After yesterday's slump, WTI crude oil gained some traction on Thursday and edged higher before retracing from session peak to currently trade around $51.60 region.The black gold got a boost from the latest weekly API inventory data that showed US crude supplies fell over 5 million barrels last week as compared to a build of 1.5 million barrels in the previous week. Adding to this, signs of fall in oil production by OPEC supported the commodity's up-move on Thursday. According to the latest data, OPEC cartel's production was lower by 221K bpd in December as compared to production in November. Meanwhile, comments from IEA Executive Director Fatih Birol that output from US shale producers would react to recent price gains fueled skepticism over OPEC's efforts to ease global supply glut and take oil market back closer to a rebalance, eventually capping further gains for the commodity.Investors now turn their attention to the official EIA report on US inventories, slated for release later during NY trading session.Momentum above $52.00 round figure mark, leading to a subsequent strength above $52.20 horizontal level, is likely to get extended towards $52.50 resistance area above which the commodity seems all set to aim towards reclaiming $53.00 handle.On the downside, follow through selling pressure below $51.50 level might drag the commodity back towards $51.00-50.90 support area, which if broken decisively seems to pave way for further near-term downslide towards the very important $50.00 psychological mark.
Disclaimer: This material is provided as a general marketing communication for information purposes only and does not constitute an independent investment research. All information provided is gathered from reputable sources and any information containing an indication of past performance is not a guarantee or reliable indicator of future performance. We assume no liability for any loss arising from any investment made based on the information provided in this communication.